Rates
The U.S. Treasury market from the Treasury’s own daily prints: the curve and how it moved, the spreads that describe its shape, what inflation-linked bonds pay, the bills cash sits in, and the auctions that price new debt.
The curve today
U.S. Treasury · Nov 19, 20263-month
4.34%
0 bp on the day
Par yield · Nov 19
2-year
4.76%
−4 bp on the day
Par yield · Nov 19
10-year
5.04%
−3 bp on the day
Par yield · Nov 19
30-year
5.40%
−1 bp on the day
Par yield · Nov 19
2s10s spread
28bp
+4 bp in a week
10-year less 2-year · Nov 19
10-year breakeven
2.16%
−19 bp in a month
Nominal less TIPS · Nov 19
On Nov 19, 2026 the 10-year Treasury yield fell 3 bp to 5.04%, and the 2-year fell 4 bp to 4.76%. The spread from 2 years to 10 years is 28 bp, at or above 6% of days in the past year. A 10-year TIPS yields 2.88% over inflation; against the nominal 10-year, that prices inflation at 2.16% a year.
The Treasury curve
Par yields by maturity, as the Treasury publishes them each business day- Latest · Nov 19, 2026
- A month earlier · Oct 19, 2026
- A year earlier · Nov 19, 2025
| Maturity | Yield % | 1 day | 1 week | 1 month | 1 year |
|---|---|---|---|---|---|
| 1 month | 4.20 | +10 | +8 | +9 | +19 |
| 2 months | 4.29 | +2 | +3 | +12 | +29 |
| 3 months | 4.34 | 0 | +2 | +7 | +39 |
| 4 months | 4.35 | 0 | 0 | +1 | +49 |
| 6 months | 4.42 | −1 | 0 | +5 | +62 |
| 1 year | 4.62 | 0 | −3 | +12 | +94 |
| 2 years | 4.76 | −4 | −10 | −1 | +118 |
| 3 years | 4.81 | −3 | −9 | −4 | +122 |
| 5 years | 4.86 | −3 | −9 | −8 | +115 |
| 7 years | 4.94 | −2 | −8 | −10 | +104 |
| 10 years | 5.04 | −3 | −6 | −11 | +91 |
| 20 years | 5.43 | −1 | −5 | −10 | +72 |
| 30 years | 5.40 | −1 | −3 | −8 | +65 |
Changes in basis points (0.01 percentage point), against the last print on or before each date.
U.S. Treasury, Daily Treasury par yield curve rates · data for Nov 19, 2026 · read Nov 20, 3:47 PM ET
Curve spreads
Longer yield less shorter, basis points, with where each sits in its past year| Spread | Now | 1 week | 1 month | 1 year | Year low–high | Place in the year |
|---|---|---|---|---|---|---|
| 3 months to 10 years3m10y | 70 | −8 | −18 | +52 | 8 to 109 | |
| 2 years to 10 years2s10s | 28 | +4 | −10 | −27 | 20 to 74 | |
| 5 years to 30 years5s30s | 54 | +6 | 0 | −50 | 41 to 114 | |
| 10 years to 30 years10s30s | 36 | +3 | +3 | −26 | 29 to 68 |
A negative spread is an inverted curve: the longer bond yields less than the shorter one. The mark shows where today sits between the year’s low and high.
- 2 years to 10 years, bp
- 3 months to 10 years, bp
U.S. Treasury, Daily Treasury par yield curve rates · data for Nov 19, 2026 · read Nov 20, 3:47 PM ET
Real yields and breakevens
TIPS pay a yield over inflation; the gap to the nominal bond is the inflation it prices| Maturity | Real % | Nominal % | Breakeven % | Real, 1 month | Breakeven, 1 month |
|---|---|---|---|---|---|
| 5 years | 2.64 | 4.86 | 2.22 | +8 | −16 |
| 7 years | 2.76 | 4.94 | 2.18 | +9 | −19 |
| 10 years | 2.88 | 5.04 | 2.16 | +8 | −19 |
| 20 years | 3.12 | 5.43 | 2.31 | +6 | −16 |
| 30 years | 3.24 | 5.40 | 2.16 | +3 | −11 |
Changes in basis points. A breakeven is nominal less real on the same day and maturity; it includes a risk premium, so it is not a forecast of inflation.
- 10-year breakeven, %
U.S. Treasury, Daily Treasury par real yield curve rates (TIPS) · data for Nov 19, 2026 · read Nov 20, 3:46 PM ET
Bills
Where short-term cash earns, by maturity| Bill | Matures | Discount % | Yield % | 1 week |
|---|---|---|---|---|
| 4-week | Dec 22 | 4.05 | 4.12 | +8 |
| 6-week | Dec 31 | 4.08 | 4.16 | +8 |
| 8-week | Jan 19 | 4.11 | 4.19 | +2 |
| 13-week | Feb 18 | 4.16 | 4.26 | +2 |
| 17-week | Mar 23 | 4.24 | 4.36 | +1 |
| 26-week | May 20 | 4.31 | 4.47 | +1 |
| 52-week | Oct 28 | 4.39 | 4.60 | −4 |
Closing rates on the most recently auctioned bill of each maturity. Yield is the coupon-equivalent, comparable with notes and commercial paper.
U.S. Treasury, Daily Treasury bill rates · data for Nov 19, 2026 · read Nov 20, 3:46 PM ET
The Fed’s range
The rate the front of the curve is anchored toThe federal funds target range is 3.75–4.00%, in effect since Sep 17, 2026. Banks earn 3.90% on reserves held at the Fed. The next decision is due Wed Dec 9, 2026, with new projections.
| Took effect | From % | To % | Change |
|---|---|---|---|
| Sep 17, 2026 | 3.50–3.75 | 3.75–4.00 | +25 bp |
| Dec 11, 2025 | 3.75–4.00 | 3.50–3.75 | −25 bp |
| Oct 30, 2025 | 4.00–4.25 | 3.75–4.00 | −25 bp |
| Sep 18, 2025 | 4.25–4.50 | 4.00–4.25 | −25 bp |
| Dec 19, 2024 | 4.50–4.75 | 4.25–4.50 | −25 bp |
| Nov 8, 2024 | 4.75–5.00 | 4.50–4.75 | −25 bp |
Federal Reserve Board, FOMC meeting calendar · read Nov 20, 3:30 PM ET
Where overnight money is trading inside this range: Cash & funding.
FRED, Federal Reserve Bank of St. Louis, Federal funds target range, upper and lower limits (DFEDTARU, DFEDTARL) · range as of Nov 20, 2026 · read Nov 20, 2:55 PM ET
Treasury auctions
New supply: what is coming, and how the last sales wentComing up
| Auction | Security | Size | Settles |
|---|---|---|---|
| Mon Nov 23 | 13-week bill | $95.0bn | Nov 27 |
| Mon Nov 23 | 2-year note | $69.0bn | Nov 30 |
| Mon Nov 23 | 26-week bill | $82.0bn | Nov 27 |
| Tue Nov 24 | 2-year FRN (reopening) | $28.0bn | Nov 27 |
| Tue Nov 24 | 5-year note | $70.0bn | Nov 30 |
| Tue Nov 24 | 52-week bill | $54.0bn | Nov 27 |
| Tue Nov 24 | 6-week bill | $90.0bn | Nov 27 |
| Wed Nov 25 | 17-week bill | Not yet announced | Dec 1 |
| Wed Nov 25 | 4-week bill | Not yet announced | Dec 1 |
| Wed Nov 25 | 7-year note | $44.0bn | Nov 30 |
Results, notes and bonds first
| Date | Security | Stop % | Cover | Indirect | Dealers |
|---|---|---|---|---|---|
| Nov 19 | 10-year TIPS (reopening) | 2.903 | 2.43× | 68.6% | 6.0% |
| Nov 18 | 20-year bond | 5.459 | 2.63× | 60.2% | 13.1% |
| Nov 12 | 30-year bond | 5.441 | 2.36× | 68.1% | 11.4% |
| Nov 10 | 10-year note | 5.020 | 2.46× | 61.2% | 9.8% |
| Nov 9 | 3-year note | 4.627 | 2.53× | 55.5% | 9.5% |
| Nov 19 | 26-week cmb (reopening) | 3.968 | 3.97× | 45.9% | 52.1% |
| Nov 19 | 4-week bill | 4.119 | 2.55× | 59.3% | 36.4% |
| Nov 19 | 8-week bill | 4.194 | 2.72× | 67.8% | 27.9% |
| Nov 18 | 17-week bill | 4.350 | 3.05× | 56.8% | 37.5% |
| Nov 17 | 6-week bill | 4.131 | 2.82× | 65.7% | 29.7% |
Stop is the highest yield accepted (for bills, the investment rate). Cover is dollars bid per dollar sold. Indirect bidders are mostly foreign official accounts and funds bidding through dealers; dealers take what others do not. A floating-rate note has no stop yield.
TreasuryDirect, Auction announcements and results · latest result Nov 19, 2026 · read Nov 20, 3:45 PM ET
Open Calls
Dated forecasts on this subject, scored in public when they resolve- 72%Will the ECB’s published deposit facility rate be at most 2.5% on 6 November 2026?Open Call · resolves Nov 6, 2026 · Call Card
- 62%Will the U.S. Treasury’s published 10-year Treasury yield be at least 4.990% on November 8, 2026?Open Call · resolves Nov 8, 2026 · Call Card
- 62%Will the published daily change in the 10-year Treasury yield reach at least +3 bp on any business day by 2026-11-10?Open Call · resolves Nov 10, 2026 · Call Card
- 62%Will Meta’s final euro bond pricing show a spread at least 0.9 point wider than its comparable April note by 2026-11-11?Open Call · resolves Nov 11, 2026 · Call Card
Every Call and how it resolved: Track record.
ARCANE reporting
Published investigations, newest first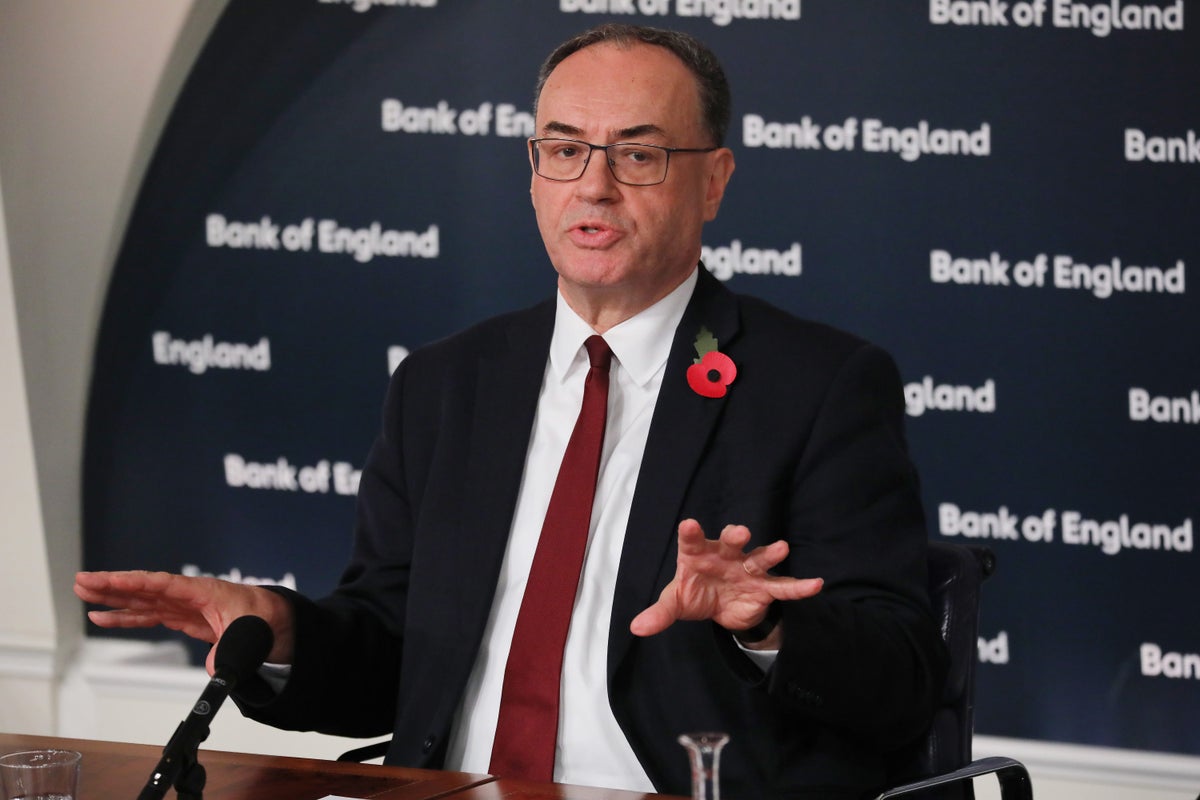
Chain Reaction
Traders expect more interest-rate increasesCapital is leaving gold as Treasury yields raise the cost of holding an asset that pays no yield.
rates · Nov 19, 2026

Early Warning
Oil and stocks help pull Treasury yields lowerBond buyers are exposed to a growth test if higher borrowing costs return.
Rates · Nov 16, 2026

Hidden Risk
Nvidia bonds keep calm as leadership risk moves to KressThe next earnings report will test whether credit investors treat the CEO shock as a governance problem or a passing equity scare.
Rates · Nov 16, 2026

Against Interest
The US bought little yen as Japan warned traders againA small US trade puts more weight on the Bank of Japan rate path for households, funds and companies with yen exposure.
FX · Nov 14, 2026
Sources
Every number above, where it comes from and when it was read- U.S. TreasuryDaily Treasury par yield curve ratesData for Nov 19, 2026 · read Nov 20, 3:47 PM ET
- U.S. TreasuryDaily Treasury par real yield curve rates (TIPS)Data for Nov 19, 2026 · read Nov 20, 3:46 PM ET
- U.S. TreasuryDaily Treasury bill ratesData for Nov 19, 2026 · read Nov 20, 3:46 PM ET
- TreasuryDirectAuction announcements and resultsData for Nov 19, 2026 · read Nov 20, 3:45 PM ET
- FRED, Federal Reserve Bank of St. LouisFederal funds target range, upper and lower limits (DFEDTARU, DFEDTARL)Data for Nov 20, 2026 · read Nov 20, 2:55 PM ET
- Federal Reserve BoardFOMC meeting calendarData for Nov 20, 2026 · read Nov 20, 3:30 PM ET